3D moisture mapping: Why we do it!
Conservation, Digital, Sustainability | Written by: Guest | Friday 29 December 2017
Sofia Antonopoulou, former SIGMA Digital Documentation Officer, explains why Historic Environment Scotland’s conservation teams are using 3D moisture mapping to analyse and protect the properties we care for.
3D moisture mapping is a collaborative project developed by Historic Environment Scotland’s Digital Documentation and Conservation Science teams, both based at the Engine Shed. The project looks at combining different forms of 2D and 3D digital data, improving our understanding of how traditionally constructed buildings work and what we can do to better care for and conserve them.
Why is moisture important in old buildings?
Our conservation scientists have been collecting and analysing data on the moisture content of the built fabric (material) of the properties we care for. High levels of moisture are closely linked to decay in traditionally constructed buildings, affecting materials like stone, brick, and wood in various different ways. For example, localised water ingress (leakage or seepage caused by lack of maintenance or faulty drainage) can lead to decayed stonework, damp and biological growth like mould, moss and lichen.
Conservation scientists use a number of techniques to measure moisture levels in materials like stone. Unlike other techniques, which required taking samples of a building’s materials, modern techniques are usually non-destructive. They don’t require harming the building’s fabric like taking samples does.
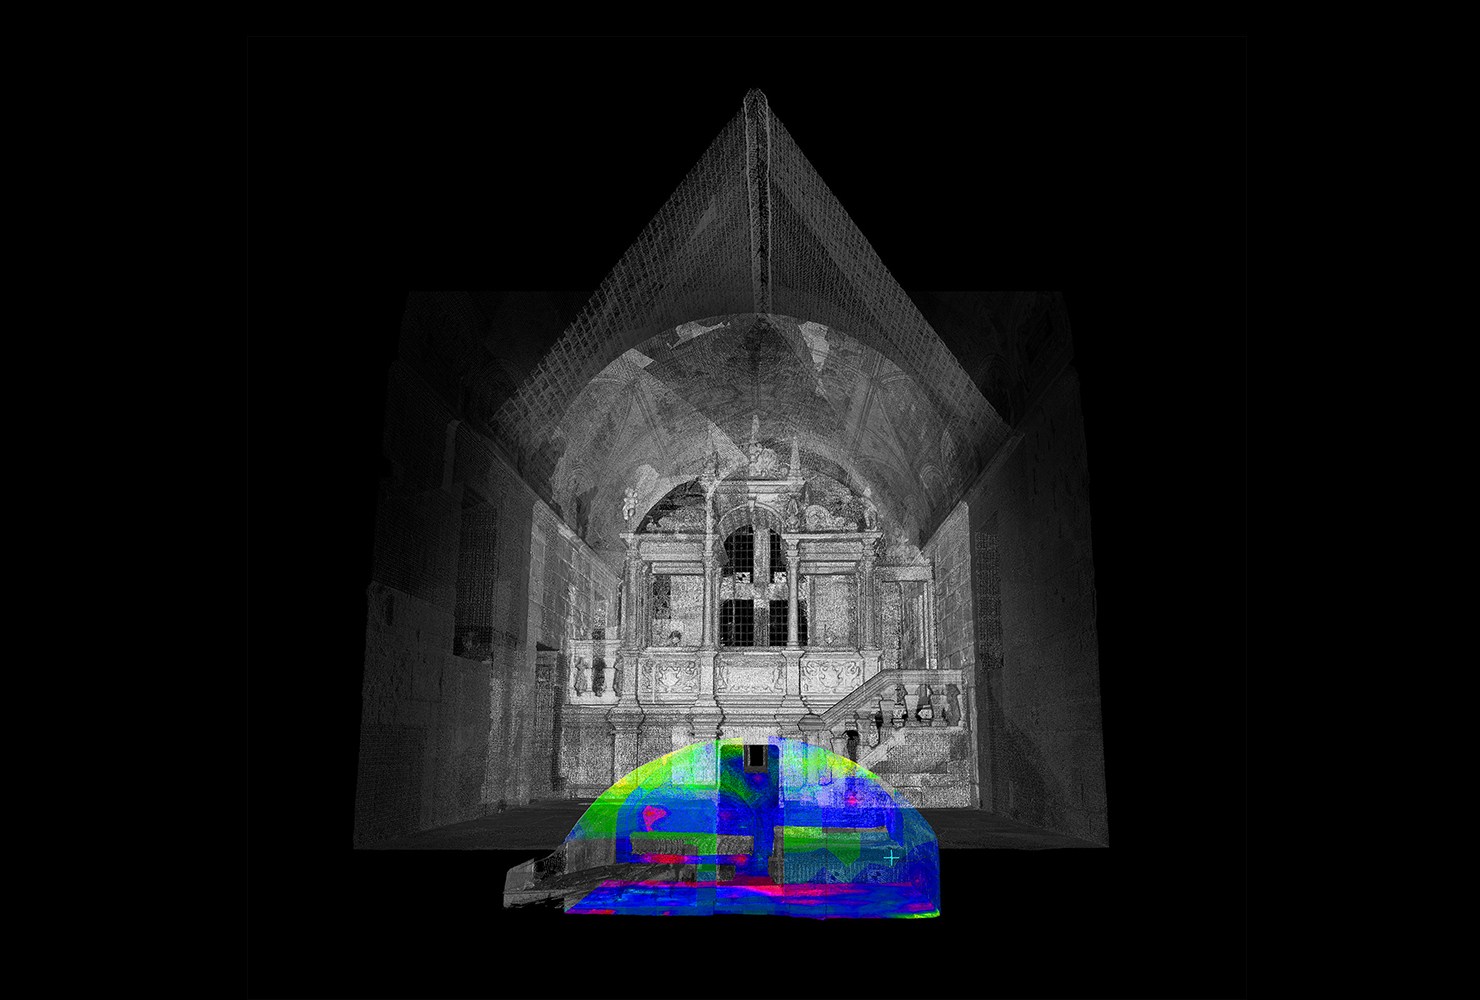
Vertical view of 3D point cloud of Skelmorlie Aisle coloured with moisture data.
One of these non-destructive methods is using microwave moisture meters. The device emits microwaves into a wall and detect the amount of microwave energy it absorbs. The technique works very well for solid stone walls and has been used for the environmental monitoring of historic buildings.
What are moisture maps?
Microwave moisture meters take moisture readings up to a range of specific depths in the material, depending on the sensor head being used (3cm, 11cm, 30cm, 80cm). For example, the 3cm sensor would focus largely on moisture levels in the surface finish on a wall. We take individual readings on the surface of the area in question at a set spacing, creating a regular grid of measured values. The results are analysed using specialist software, which generates maps of moisture distribution from the individual data points, using darker colours to represent areas of higher moisture content and lighter colours for drier areas.
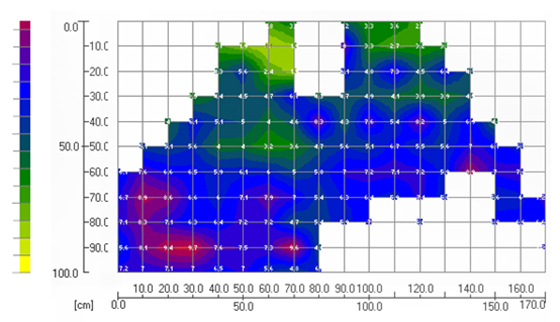
Fig 4: Moisture map of a wall surface: red colour indicates wet areas.
Why 3D moisture mapping?
Microwave moisture maps contain a lot of information about the moisture content of different areas in the structure, but they only show one surface (or part of a surface) at a time, like a wall, floor, or ceiling. To get the full picture of what’s happening in a room, you’d need to look at several of these maps, possibly cross-referencing them with moisture maps for rooms next door, above or below. Because traditional buildings tend to have complicated structures, it can be difficult to visualise the overall structure.
It’s important that this complex scientific data can be communicated in a clear and consistent way. This is where the idea of 3D moisture mapping comes from. By combining 2D moisture maps with 3D geometry, we can produce 3D coloured models which are much easier to read and understand.
How is it done?
Using moisture data gathered by the Conservation Science team, and laser scanned 3D point cloud data from the Digital Documentation team, we can overlay a moisture map onto a point cloud using specialist software. One way to do that is by choosing points shared by both the image and the point cloud, ensuring that the image is matched to the correct part of the cloud. The software then overlays the two, “burning” the colour information onto the point cloud. The result is a coloured point cloud, where each point has a colour value corresponding to the specific moisture content at a set depth into the material.
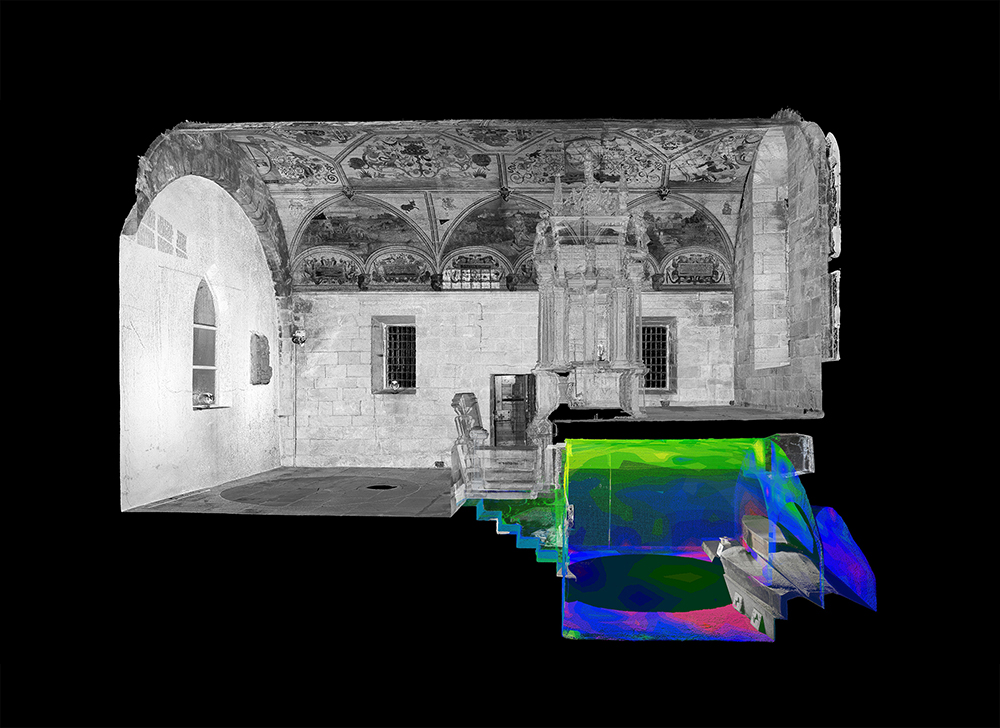
Section view of 3D point cloud of Skelmorlie Aisle coloured with moisture data
What can we do with the data?
Once the moisture maps have been overlaid with the point cloud, there are many interesting possibilities. The point cloud can be exported in any point cloud format and imported into other applications, free 3D viewers or online platforms like Sketchfab. This means that the full 3D information can easily be accessed. The point cloud can also be used to create animations and 2D renderings from any angle. Information can be added to the model, aiding interpretation and understanding. The 3D moisture point cloud becomes an amazing resource for communicating complex scientific data in a clear, approachable way. We’re also experimenting with 3D mapping of other types of data, like thermal imaging.
This short animation depicts moisture measurements burned onto the 3D point cloud, with wet areas of the crypt showing in red.
Explore Technical Paper 35 on Moisture Measurement in the Historic Environment.
For more information about the work of the Digital Documentation team, look for #RaeProject on Twitter.
About the author: Sofia worked with the Digital Documentation team, focusing on the use of digital technologies to document heritage sites and objects. Sofia has since moved onto pastures new.
About the author:
Guest
From time to time we have guest posts from partners, visitors and friends of the Engine Shed.
View all posts by Guest
